Smart-home energy monitoring can reveal when electricity use changes and how much a measured load consumes. It cannot automatically explain every change, identify every appliance correctly, or prove that an automation saved money.
The useful first step is to decide which question you want the data to answer. Then choose a measurement layer that is actually capable of answering it.
Begin with a question the system can answer
The most useful energy dashboard starts with a household question. You might want to know why electricity use rises after dinner, whether an empty-house schedule still runs equipment, or whether a specific appliance uses enough energy to justify closer attention. Those questions require different levels of measurement.
Write the question before choosing hardware. If you only need to see when total grid use rises, utility interval data may be enough. If you need to measure one supported plug-in load, an individual meter may provide clearer evidence than a sophisticated whole-home appliance label. More sensors are useful only when they reduce the uncertainty that matters to your decision.
A helpful question has a defined boundary. “What accounts for the overnight baseline between midnight and morning?” is more testable than “Which device wastes energy?” The first gives you a time period and an observable quantity. The second assumes waste before you know which functions are necessary.
Monitoring can also confirm that there is no practical problem. A small, stable standby load may not justify the purchase, effort, or inconvenience required to eliminate it. Include “leave the current setup alone” among the possible outcomes.
Choose the measurement layer that answers your question
Layer | Useful question | Important limit |
|---|---|---|
Utility interval data | When does grid use rise? | May be delayed or less detailed than device data |
Whole-home monitor | How does total use change through the day? | Does not inherently identify each appliance |
Circuit monitoring | Which measured circuit contributes? | A circuit can serve several devices |
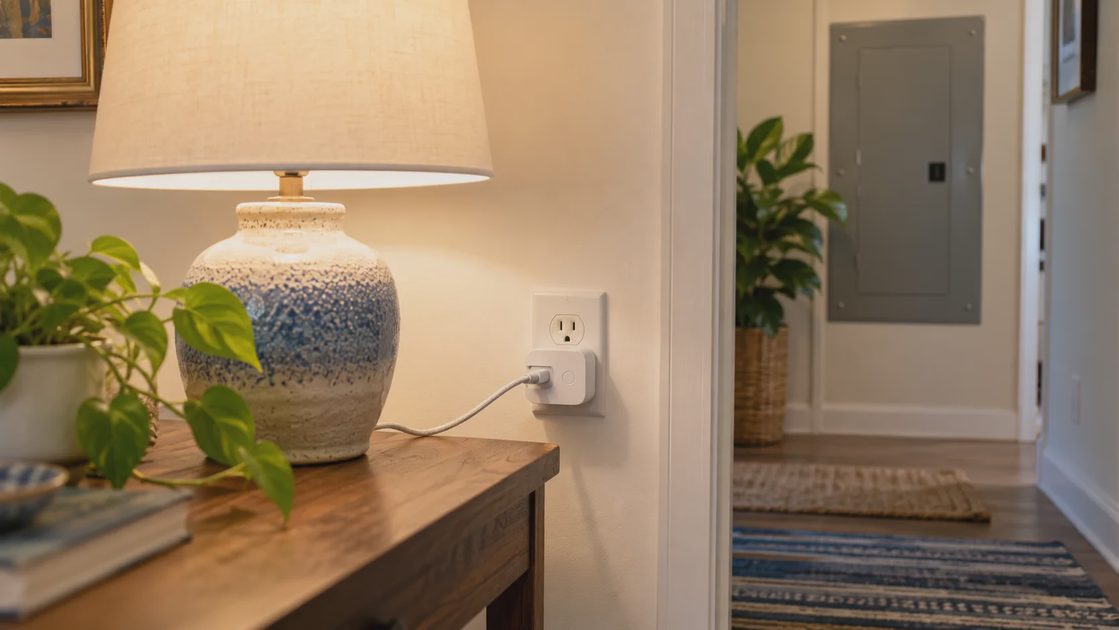
Suitable plug-in meter | How much does this approved load consume? | Does not cover hardwired equipment or unmeasured loads |
Installing equipment inside an electrical panel belongs with a qualified professional. The panel's appearance of being switched off does not establish that all parts are safe to touch.
Solar generation and batteries can change the relationship between household consumption and utility imports. Confirm which quantity the chart displays before making comparisons.
Distinguish consumption, imports, exports, and production
In a home without generation or storage, utility electricity use often provides a useful picture of the energy supplied to the house. With solar panels or a battery, several quantities become relevant. A chart may show household demand, grid imports, solar production, exports, or battery charging. Those values are related, but they are not interchangeable.
Quantity | What it describes | A question it can help answer |
|---|---|---|
Household consumption | Electricity used by household loads | How much energy did the home need? |
Grid import | Electricity drawn from the utility | When did the home buy electricity? |
Grid export | Electricity sent back to the grid | When was surplus generation available? |
Solar production | Electricity generated by the solar system | How did generation vary? |
Battery charge/discharge | Energy moving into or out of storage | How did storage alter grid demand? |
Avoid constructing a total by adding every number on the screen. Some quantities already include others, and storage introduces timing and conversion losses. Follow the monitor's documented energy-flow definitions before doing your own calculation.
For example, a fall in afternoon grid imports might reflect more solar production rather than lower household consumption. That can still affect the bill, but it does not prove an appliance or automation became more efficient. Name the quantity precisely in your notes so the conclusion matches the data.
Check units and totals first
Power, expressed in watts or kilowatts, is not the same as accumulated energy in kilowatt-hours. Home Assistant's energy FAQ explains this distinction and documents how sensor configurations can inflate totals.
Check the reporting interval, time zone, reset behavior, and missing-data handling. Avoid adding a whole-home total to the circuits already included in it. That double-counts consumption.
If a chart suddenly changes after an integration update, inspect the data pipeline before assuming a physical appliance fault.
Check the data path before trusting the chart
A dashboard is the end of a chain: a sensor takes a reading, a device reports it, an integration interprets it, and the dashboard groups it into a time interval. A fault anywhere in that chain can create a graph that looks persuasive while describing the wrong quantity.
Start with a small validation checklist:
Confirm the sensor represents the intended load or measurement point.
Confirm whether its unit is W, kW, Wh, or kWh.
Confirm whether the value is instantaneous, cumulative, or per interval.
Confirm how resets and unavailable readings are handled.
Confirm the dashboard time zone and reporting boundaries.
Confirm that parent totals and included subloads are not added twice.
If you changed an integration, migrated a device, or renamed sensors, check whether the dashboard still points to the right source. A new entity with a familiar name may have a different reporting behavior. Compare the raw sensor history with the dashboard summary before attributing a sudden increase to household activity.
A gap deserves an explanation. Missing data may mean the device stopped reporting, not that the household stopped consuming electricity. Treat reconstructed values and estimated intervals as estimates. When exporting a report, retain those limitations alongside the totals.
Treat a pattern as a lead to investigate

A recurring evening peak might align with cooking, cooling, charging, or several activities at once. A chart alone cannot tell you which explanation is correct.
Keep a short activity log. Compare the timing with directly measured loads where safe and appropriate. If a monitor assigns appliance names algorithmically, treat those labels as estimates until confirmed.
Do not switch essential loads off to identify them. Ask an installer or use supported device-level data when the question involves hardwired equipment.
Use a household activity log to interpret peaks
A peak indicates that demand changed during a recorded interval. It does not automatically reveal the cause. Several modest activities can overlap, and a large load can begin just before or after the chart's visible time boundary.
For a few representative days, pair the chart with a simple log. Record major cooking periods, laundry, heating or cooling activity, charging, visitors, and unusual schedules. Exact minute-by-minute surveillance is unnecessary; the purpose is to establish plausible relationships that you can investigate further.
Observation | Possible explanation | Useful next check |
|---|---|---|
Evening rise during dinner | Cooking and other simultaneous loads | Compare a similar evening with a different cooking pattern |
Overnight baseline changes | A schedule, charging, or continuous load changed | Review known overnight tasks and supported device data |
Weekend total exceeds weekdays | More occupancy or different activities | Compare usage hours, not just calendar labels |
Sudden permanent step upward | New equipment or a configuration change | Check installation and change records |
These are hypotheses, not appliance diagnoses. A pattern that aligns with cooling does not prove an HVAC fault. Weather and occupancy can alter legitimate demand. If the concern involves equipment performance, use the energy data as context for a qualified assessment rather than attempting unsafe electrical experiments.
Treat automatic appliance names as estimates
Some monitors infer device activity from electrical patterns. A label such as “dryer” or “unknown motor” can make a chart easier to understand, but its confidence depends on the product, the household, and the available signals. A convincing name should not be treated as equivalent to a dedicated meter attached to that appliance.
Where the product supports it, confirm labels against ordinary operation and manufacturer instructions. Note whether multiple appliances share a circuit or operate together. Record disputed labels instead of repeatedly editing them until the dashboard appears tidy.
An inferred category can be useful even when it is imperfect. It may identify a period worth examining or reveal a new pattern. The limitation is the strength of the conclusion: “this event may be associated with the dryer” is different from “the dryer consumed this exact amount.”
Do not turn off essential equipment or open a panel to force a recognizable signal. A monitoring system should reduce uncertainty without introducing a new household risk. If identification requires professional circuit tracing, include that effort in the decision about whether the information is worth obtaining.
Compare like periods before claiming improvement
A lower total after a change is encouraging, but it is not automatically evidence that the change caused the reduction. You also need to ask what else changed. A mild-weather week, fewer occupants, or fewer laundry loads can reduce use independently of a revised automation.
Build comparisons around the task and relevant conditions:
Record a baseline before changing the configuration.
Describe the one change you are testing.
Choose comparable observation periods.
Note weather, occupancy, and activity differences.
Compare the measured quantity and the household result.
Repeat when the pattern is unclear.
For cooling, similar outdoor conditions and occupancy improve the comparison, but they do not perfectly normalize the building's thermal behavior. For a lamp schedule, actual on-time may be a more direct measure. Match the level of caution to the question instead of using one universal “before and after” method.
A practical household observation can support a modest conclusion: “the new schedule avoided an unnecessary operating period on the days recorded.” It cannot establish a precise annual savings guarantee without a much stronger measurement basis. Keep the useful local finding and avoid extending it beyond the evidence.
Separate energy reduction from bill reduction
A lower kWh total can coexist with a higher bill if prices or fixed charges increase. Conversely, shifting use to a cheaper period can reduce cost without reducing energy.
Apply the actual tariff, including relevant time periods. Record the billing dates. For solar homes, clarify import, export, and compensation rules rather than multiplying every household kWh by one retail price.
Virginia Cooperative Extension's guide is useful for basic energy-estimation arithmetic. It does not make your monitor's estimate equivalent to a utility settlement.
Read the bill alongside the energy record
Energy and cost answer different questions. An automation may lower consumption yet produce little bill reduction because fixed charges remain. A schedule may lower cost by shifting electricity use to a cheaper period while consuming a similar number of kWh.
Compare the following before judging the result:
Bill element | Why it matters |
|---|---|
Billing start and end dates | Calendar dashboard totals may cover a different period |
Number of billing days | A longer cycle can increase the total without higher daily use |
Variable energy rate | Rate changes affect cost independently of consumption |
Time-of-use periods | Timing can change the cost of the same kWh |
Fixed charges | Usually remain after small consumption reductions |
Solar import/export treatment | Retail consumption and credited exports may have different values |
If your rate includes other components, consult the actual tariff rather than guessing how to price the data. A monitor's estimated dollar figure is only as good as its rate configuration and treatment of those components.
A useful report can show measured kWh and estimated variable cost separately. That allows the household to see whether a change reduced energy, shifted timing, or both. It also prevents a rising utility bill from obscuring a genuine reduction in consumption.
Keep privacy and maintenance proportional to the benefit
Detailed energy records can reveal activity patterns. Before connecting another service, check who receives the data, what account access it needs, and whether the information can be exported or deleted. Consider whether the desired decision actually requires long-term cloud history.
Document the monitor's owner and the reason it exists. If a dashboard depends on a custom integration, record the measurement definitions so the next person does not inherit a graph with no explanation. Avoid storing credentials in the same worksheet as appliance notes.
There is also an ownership cost. Sensors, integrations, and historical databases need occasional attention. A monitor that consumes hours of troubleshooting without supporting any decision may not be earning its place. A simple monthly review of a reliable data source can be more valuable than an elaborate screen nobody trusts.
Ask the data to support one next action
Choose a bounded question, such as whether an approved plug-in load has material standby consumption or whether a schedule runs during an empty period.
Make one change, note the conditions, and compare relevant intervals. Weather, occupancy, and different operating tasks remain possible explanations.
Monitoring earns its place when it helps you investigate and decide. Collecting more graphs without a question can become another form of smart-home clutter.
Turn the evidence into a small action plan
Finish each investigation with a decision, a reason, and a way to check the outcome. For example: adjust a nonessential lighting schedule because the activity log showed it running after everyone had left the room, then verify that the revised timing still meets the household's needs.
A compact record is enough:
Question: what you wanted to understand.
Evidence: the measurement interval and supporting observations.
Limitation: alternative explanations or missing data.
Action: the setting or habit you will change.
Review: when and how you will check the result.
This keeps energy monitoring connected to everyday usefulness. You do not need to identify every watt to make a sensible improvement. You need enough trustworthy information to choose one proportionate action and enough context to know whether it helped.